Infographics
As a business, when you have content that you want to promote or share what do you do?
Infographics have been around for hundreds of years and they continue to be a popular way to covey information and data. One of the popular ways to share an infographic today is through social media networks. Images tend to be received very well on social media sites and infographics will continue to be widely used.
Infographics can promote and share your information in an interesting way.
- Benefits of creating infographics:
- Displaying a creative design
- Displaying slides of information & data or static content
- Creating interactive content
- Engaging your audience
- Turning basic knowledge into interesting content
- Providing facts & data
- Simplifing complex data
- Promoting & sharing information
- Creating compelling content
- Introducing a product or service
- Creating incentive opportunities
- Increasing your traffic
- & many more…
What to consider when creating an infographic:
- Audience- Your audience is a very important factor to consider when you are creating your content. The audience factors in the type and style you deliver your content.
- Genre- If you are creating an infographic you can consider if it will be compelling, serious, informative, humorous, bone chilling, etc.
- Content- What content & data is important to display.
What social media networks are best to display your infographic?
- Google +
- Stumble Upon
- Linked In
- & more…
Try not to limit where you share your infographic. The best way for your infographic to start spreading (other than making sure it has unique content) is by getting it out there. Yes, Facebook and Twitter are good social networks to start. However, if you want your infographic to go viral, do not be afraid to post it everywhere.
Here is an example of what you can do with an infographic. This past Sunday, November 3rd, our office has been blogging for a complete year. I thought it was fitting to quickly create an infographic to display the most popular blog categories.
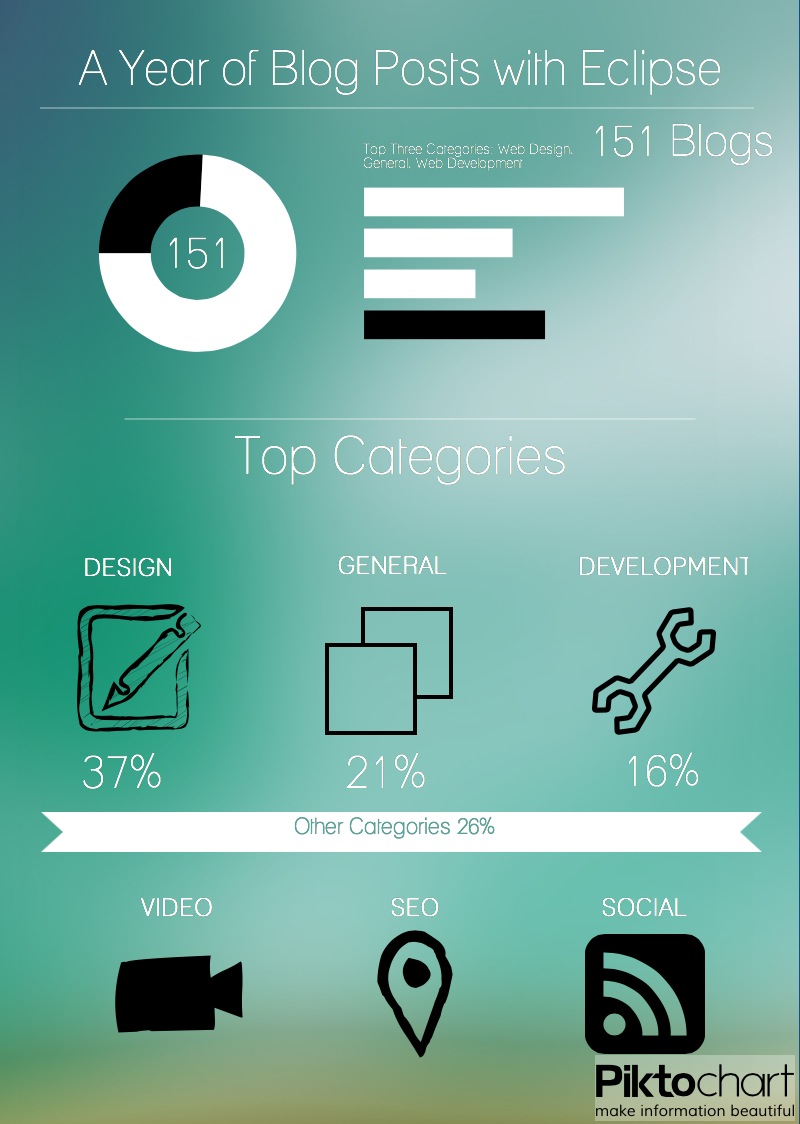
While this infographic probably would not receive much interest outside Blueprint offices, our employees will enjoy it. It shows how far we have come in a year and also, it gives us an idea of what has not been a main focus. We try to make sure there is variety in what we post, but while this is the case, every post is unique by content and our numerous authors.
By: Kara
The comments are closed.
No reviews yet